Creating Camera Profiles with a Sekonic Light Meter – Part II
This post is a continuation from a previous post. To see Part I, go HERE. Again, if you want to just use the profiles I created download the files from this google drive folder. Currently I only have profiles for the Alexa Mini with the LCC lut in 800 and 1600 ISO, as well as the FX6 with the Rec 709 Type A Lut at 800 and 1600 ISO.
Preparing the images
Now that you’ve shot all the images, we’ll bring them into resolve to export out images and do whatever image treatment is necessary. This will require you to have some knowledge of resolve, but the operations are all very simple.
Organizing in Resolve
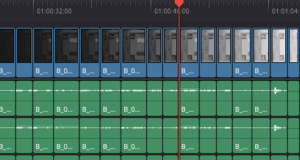
My clips -10 through +10 on the resolve timeline.
I have found it is most easy to organize all of this by creating a project called Sekonic DTS. In this project you’ll create bins for each camera, within each bin you’ll create further sub-folders for each ISO that you shoot.
-
Bring all of the clips into resolve.
-
Put them on a single timeline with the clips starting at -10 and going to +10. At the very end put your gray card image.
Apply your LUT if Needed
Now you’ll need to decide if you’ll want to process these clips or not before you export the JPEGs. For me, I want to shoot and expose for a lower contrast Rec 709 LUT. I don’t like the standard REC 709 LUTs as I find the shadows to be too crunchy. So I’ll use the Arri LCC 709 LUT and the SLog3-Cine709 LUT for Sony Cameras. I have not imported any log images into the DTS software as I want the meter to tell me at what point I will begin to clip in the LUT, not in the log image. If I’m stuck in a tough situation with overly bright windows, I can always check the waveform of my log image to see what detail is still there, but ultimately I don’t want us on set looking at anything with overly bright highlights or lots of shadow clipping, so I’ll expose for the LUT.
If you want to put another LUT onto the footage and re-export it, here’s a folder with all of the clips in it. They are very short to keep file size down, but you can apply any LUT you like to them, then import them into the DTS software to find your new dynamic range and mid-tone value.
Now go to color tab you’ll apply whatever LUT you like to the footage.
Exporting Stills
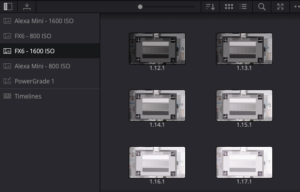
My stills gallery, using Still Albums to organize by camera and ISO
- Create a New Still Album in your Gallery. Label it with the camera and the ISO.
- Right click on the viewer
- Click Grab All Stills > From Middle Frame
Now you will have stills of each shot in your gallery.
- Select all the stills in the gallery, make sure they are only frames from -10 – +10
- Right click, press Export
- Whatever you type in will be the prefix, use the ISO as your Prefix (Ex. 800ISO – )
- Select JPEG or TIFF as the image type.
Evaluating Footage
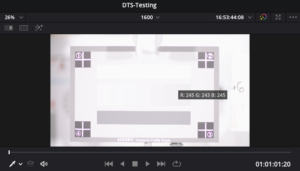
Qualifer getting RGB values.
Once you have completed exporting the images, you will need to gather some data on when the images are clipping and where the mid-tone is.
First go to your gray card image.
- Select the Qualifier tool in the bottom right of the viewer window.
- Right-click on the image in the viewer and select Show Picker RGB value
Now you’ll look at the final image and get the RGB picker values for a fully clipped image. We’re using 8 bit values, so while 0-256 is our range, you’ll notice things will begin to clip before 256. For example on the FX6 I noticed it was around 250 that the image completely clips.
Write down the average RGB value for the following:
- Dynamic Range (+ Exposure)
This is the max value you can find in your set of exposures.
- Clipping Point (+ Exposure)
Gray where there is some perceptible change in detail from fully clipped. Basically find the first gray chip where you feel like there is sufficient detail for your taste of the upper end of your range.
- Mid Tone Value
This is from the gray card set to the proper IRE value that we shot earlier.
- Clipping Point (- Exposure)
Same thing as the + Exposure, but this is on the dark end.
- Dynamic Range (- Exposure)
Lowest possible value you can find in the image.
For the FX6 for example, this was what I found:
- Dynamic Range (+ Exposure): 250
- Clipping Point (+ Exposure): 245
- Mid Tone Value: 115
- Clipping Point (- Exposure): 16
- Dynamic Range (- Exposure): 11
Creating the Profile
First thing you will have to do is tell the software at what point you want to consider the image clipped and at what point you want to say there is no more shadow detail. This is going to change for each camera as they will not use the entire range of values available.
- Click Option in the toolbar.
- Click Dynamic Range/Clipping Point Values
Now you’ll take the numbers you made from resolve and put them here.
In the DTS Software you will now do the following:
- Click Create New Profile
- Click Advanced Mode
- Select the target used and Extended Mode (Located on the left tab)
- Select Ambient
Entering Initial Readings
Now you’ll enter in the initial readings that you took when you lit the chart.
My spot readings were slightly different than my incident readings, that’s normal!
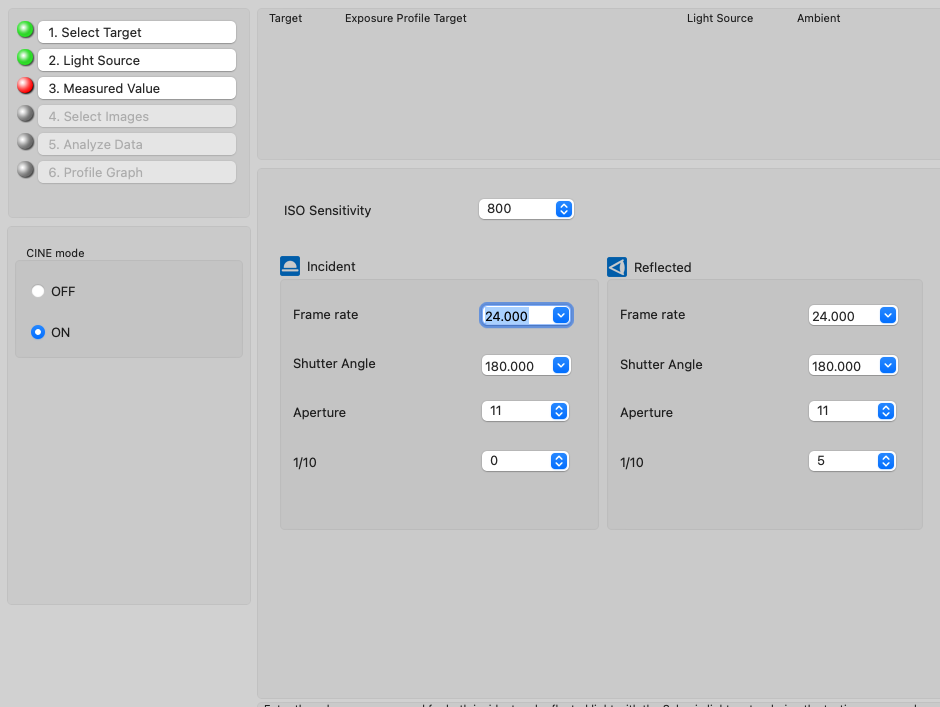
- Make sure you have Cine Mode selected, this will ensure your shutter speed will be in degrees.
- Enter in your incident exposure which should be F11 at your desired ISO, 23.976, 180 Degree shutter.
- Enter in your reflected exposure which you have written down. It will differ slightly, this is expected.
- Click Next
If for any reason you had to introduce ND in at this step, for example for one test I was having issues dimming the lights and didn’t have enough scrims, ND, or space to get them to the correct stop. If that’s the case, you can use your aperture as your exposure compensation since you will not have the ability to input that information anywhere else. As long as the exposure is technically correct, you’re ok. For example for that test I had to use an ND 1.2 in the camera for most of the test, instead of saying my reading was at F11, instead I said F45, since that is 4 stops darker and technically the same exposure as F11 with an ND 1.2.
- When prompted, select the folder that contains all of your images
Entering Exposure Data
Now comes a slightly tedious part, you’ll have to select all the images you shot and enter in your exposure data.
- Click the image for the middle exposure at +0 exposure.
- As you click the image you will have to enter in the settings you used to achieve it. Use the chart below as reference to enter in your data.
There are some notes for entering in your data
If you used exposure compensation like ND Filters, or moved the lights – You will input this as the Light Output Correction Value (EV). For example ND .3 would be -1 in EV. If you must move the lights in closer to achieve one stop more brightness, you would put +1 here.
If you used a 360 degree shutter – You’ll need to enter in 358 degrees instead. For some reason they do not include 360, but the difference between the two is neglible.
- Keep clicking all of the images until you have all of them selected to make the profile.
- If you are having issues reading the images because they are overly dark or overly bright, just remember that because you exported them in order on the timeline from resolve, 1.1.1 will be -10 1.2.1 will be -9 and so forth.
- Once you have everything entered, you should click on your +0 exposure and look at the exposure details on the left, then click on +1 and see what changes. Just make sure that you entered it all in correctly going through each clip in order. Only one variable should change at a time.
- Click Next
Alligning the Chart
Now you’ll have to line up the charts crosshairs with the crosshairs in the software so it analyzes the right part of the image.
- Follow the instructions to align the chart with the software. Its easiest to pick a bright image first and then the dark images.
- For overly dark and overly bright images, make sure to use the Brightness of Preview slider to ensure you are hitting the crosshairs.
You’re almost done! Click Next.
Now you get to see your hard work…they’ll display a graph of your dynamic range. You are able to adjust the sliders, but the sliders represent the numbers that you had set in resolve.

If you receive an error “The set level does not exist in the image”. You can ignore this error. It will not have an effect on your profile.
- Save the profile as the camera name and include the LUT name as well. Ex. Alexa Mini – LCC
Adding more ISO’s to a camera profile
As we change the ISO this is going to have an effect on our dynamic range, I would recommend doing this process for each of the ISO’s that you commonly use so you can get an idea of how you have to change your lighting as you change your ISO.
To add another ISO to a profile
- Click Option > Dynamic Range Clipping Point Values
- Enter in all of the information you’ve collected from resolve again, you’ll notice these numbers are shifting slightly.
- Click on the profile from the main menu
- Click Edit
- Click Add Iso/Light Source
Continue the process outlined above, but with the new JPEGs.
- As you add more ISO’s you will click “Add ISO/Light Source” and do the process over again. You can also select a profile from the main menu and click “Edit Profile”, then click Add ISO/Light source to do this.
- At the end, click Save and overwrite the previous profile you had. It will combine both the old ISO and the new ISO into one profile.
Comparing Profiles
Once you have all this information, it becomes really helpful to be able to compare your real-world dynamic range tests against each other. The Sekonic DTS software gives you an easy way to do this.

Pink – FX6 (709 TypeA) Vs. Purple – Alexa Mini (Arri LCC)
- Click View Profile Data/Print
- Select Multiple Profiles
- Choose Camera Comp or ISO comp
This will allow to either compare different cameras at a single iso or a single camera at different ISO’s against each other.
- Select the drop downs to put either different cameras or different ISO’s on the graph.
Transferring Profiles to Light Meter
Make sure your light meter is connected via USB.
- Select your profile
- Click the arrow button to move it over to the Selected Profile area.
- Click Transfer to Light Meter
Congrats! You’ve finished the process and you’ve learned a valuable way to compare cameras with real world results. Have a better way to do this? Something easier and faster? Feel free to contact us and let me know!