Creating Camera Profiles with a Sekonic Light Meter – Part I
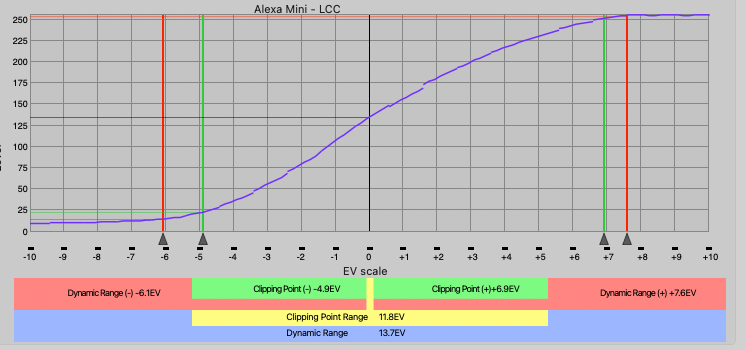
Dynamic Range Graph from the Alexa Mini with the LCC LUT
Sekonic Meters have the functionality to be able to chart and display your cameras dynamic range both on your meter and on the computer. I think this function is seldom used because of its complexity and the time most people will have to spend to understand it, especially for cinema use. I hope with this article I can make it a little bit faster and easier for you to go through the process.
Why do this?
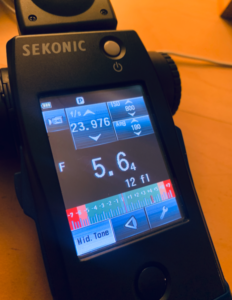
Light Meter displaying available dynamic range in spot mode.
There are a number of benefits to doing this, but the main thing you will achieve is consistency. By using a light meter you can light every shot and area in the scene to the same light levels, even when you turn around or do a large move. The other benefits are:
- Lighting without the camera present and have it look as you intended with minimal tweaking.
- Display of Dynamic Range available for the camera used. Shows if you are clipping without looking at a monitor.
- Multiple Profiles can be stored, so you are able to see how you must light differently when using a different camera.
- Able to calibrate using different ISO’s, so within the same camera you are able to see the dynamic range available if you decide to change ISO.
- No longer have to calibrate your meter as this process will accomplish that and it can be done on your own time.
- Comparison of cameras and ISO’s, as new camera systems come out this will give you the ability to compare real world data from the cameras against each others, instead of just taking the manufacturers word for it.
- I think this is one of the biggest points, that your mid-tone value is able to be shifted, so if your results while using a light meter are consistently under-exposed or over-exposed, you are able to resolve this.
- Clipping points are movable, so you are able to make your dynamic range to your taste and be very conservative, or allow more room for blown highlights in your lighting.
The process may be a little time consuming, but its well worth the effort and I think it makes your light meter even more applicable in the digital world. Most importantly you’ll end up lighting faster, better, and more precisely before you even have a monitor up.
Want to just skip everything and try my profile?
Yeahhh, alright, but you’re going to be a little limited. For now I only have
Alexa Mini with the LCC Lut in 800 and 1600 ISO
Sony FX6 with the Rec 709 Type A Lut in 800 and 1600 ISO.
The folder of them can be downloaded from this google drive link. As a warning I have not tested these on anything except for my Sekonic 858-D. I’m not sure what other meters are capable of importing these profiles. To import them you will use the Sekonic DTS software below and import them into the software.
Did you make one? Want it to be added here? Get in touch with us on the contact page.
Data Transfer Software
Sekonic has software to help guide you through the calibration process. They also have the user’s manual available for download. The user’s manual does have instructions on how to complete this process, but there are a number of helpful hints this guide will give you along the way that are more specific to motion picture cameras.
Download the software here:
http://sekonicdts.com/sekonic-dts-installation Sekonic DTS Software
Equipment
The equipment you will need is
- Camera
- Tripod
- Lenses you use most often, or Lenses with T-Stops
The faster your lenses are the better, as it will make the overexposure brackets easier to achieve. You can use lenses with F-Stops, but your results may differ as you use different lenses. For an explanation of the difference, visit this link. https://www.diyphotography.net/f-stops-vs-t-stops-use/ F-Stops Vs. T-Stops - Two lights with stands
Its best if they are identical, color temperature is not important. - Stand for the Chart
Even better if you have an iPad mount as it can nicely hold the chart without damaging it, it also will keep the C-Stand head out of the shot. - Computer for notes
- Sekonic DTS Software
Can be downloaded here: http://sekonicdts.com/sekonic-dts-installation DTS installation - DaVinci Resolve
Can be downloaded here: https://www.blackmagicdesign.com/products/davinciresolve Resolve Download - A Chip Chart
Details below
Charts
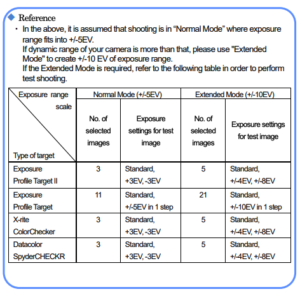
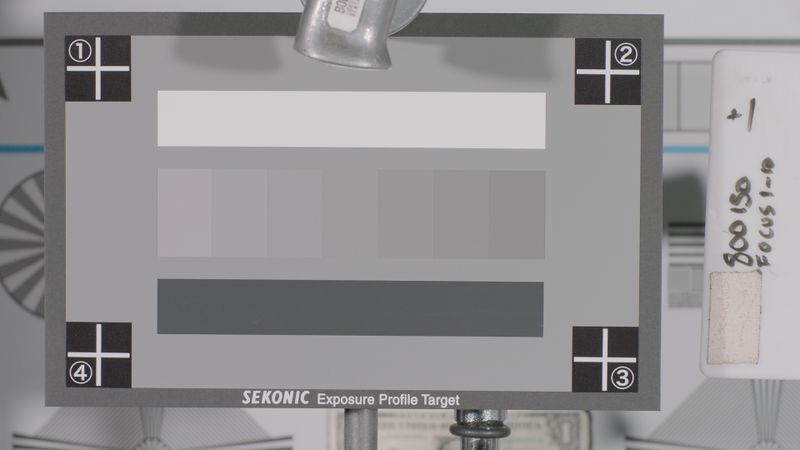
Sekonic Exposure Profile Target I – This can also be found available on E-Bay. This has 7 gray patches and a full white and black patch, as well as 18% gray covering the remainder. This is the most painful of all the charts, as it requires 21 exposures, but probably your most accurate option.
Sekonic Exposure Profile Target II– This item has been discontinued and has not been replaced by anything. They are very difficult to find used or new. These are superior to the mark I version though as they have a total of 25 gray patches in 1/6 stop increments and will take far less exposures to create an accurate result.
X-Rite ColorChecker Passport Photo – This can be used for calibration, but the company X-Rite was bought out by Calibrate recently and they have been producing all of the same products. This has 8 chips and they are very small, forcing you to put your camera very close to the chart or using a very long lens. Its unclear whether or not Calibrate is making the same exact test charts with no changes, so there is a small risk using these that it will be something that the software is not expecting. These also do not have very many chips of gray and only making 5 exposures can create a graph that does not adequately display the dynamic range of the camera. You can do the test with this chart, but its not advised. This card also does not have 18% gray so you will have to use the 4th chip over along the gray scale at the bottom. The software will compensate for you.
DataColor SpyderCheckr – This might also be a very good option, but I have not tested this one. Just a note it does not have an 18% gray square, so you will have to get an additional gray card to set your mid-tone value. For the Spot Metering, they recommend using the large square as the software will correct the difference for you.
Shooting the Chart
Now that you have all the gear together. You’ll need to shoot the chart. It should take you about 1.5-2 hours to shoot the chart if you have everything lined up. Additional ISO’s on the same camera should take 15-20 minutes.
Lighting the Chart
- Place target stand approximately 3′ away from background wall and then position camera, tripod, and lighting equipment.
- Firmly secure the chart so that it is perpendicular to the camera.
- Use two units and illuminate the target evenly at 45-degree angles. Position the lights so that they are at the same height as the target and the camera.
- The chart should be lit using an incident meter to show F11 at your desired ISO, 23.976, 180 Degree shutter. Make sure the chart differs no more than 1/10th of a stop across the chart. Lighting to this stop will give you enough room to compensate and achieve enough stops over and under to calibrate the meter.
- Turn off your camera’s auto-focus system, anti-shake function or any other functions which performs compensation. These could affect the results
- If possible, fill the frame with the chart, it will make your work much easier. The minimum target size in frame needs to be 50% or more.
White Balance
Because white balance can have an effect on exposure, you will need to perform a custom white balance to a white or gray card. You’ll perform a custom white balance and use that for all following exposures.
Shooting Exposures
You will want to shoot advanced mode as all our cameras will exceed 3 stops of dynamic range.
Depending on the chart you shoot you will have to shoot a different number of exposures at different Exposure Values. Refer to the chart to the right to determine how many are necessary.
- Confirm the chart is lit to F11 at your desired ISO, 23.976, 180 Degree shutter.
- Go to wide open and make sure the chart is sharp, then go back to your correct exposure.
- Meter the 18% gray portion of the chart using the spot meter and write down your reading including 10ths of a stop.
Some of the charts such as the SpyderCheckr and the ColorChecker do not have 18% gray patches, refer to the Charts section to see which area you should meter instead. - Place a writing surface to the right of the chart
I did this by grabbing an insert slate in a C-Stand and only including a small bit of the back in the frame. You’ll use this to mark which exposure is which and what ISO you’re at. - Shoot all the clips needed
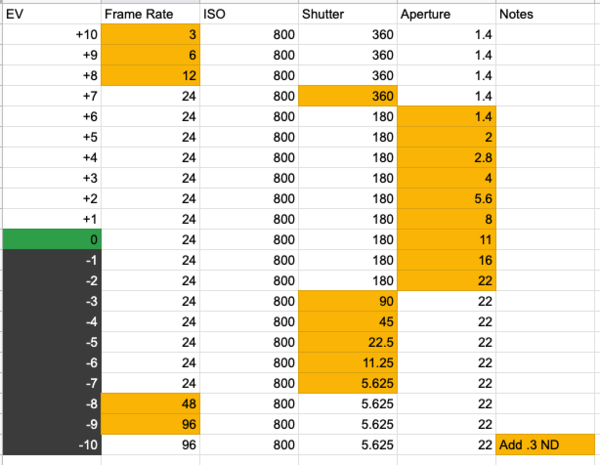
You can use the below exposures, I have included all of the possible exposure values that you’ll need for the chart that has the maximum exposures, you may not use all of them. I have highlighted yellow the parameter that you’ll need to change to get to the next exposure.
Make sure to not nudge the camera at all, it will make the process much easier if the camera remains in the same place the entire time, the same with the chart. You’ll write down how many stops over or under you are on the slate.
- Write down any changes to exposure.
It is ideal to just use ND’s rather than moving the lights as this can be easily compensated later and is a bit more exact. If you must, moving the lights is acceptable.
If for some reason you need to put ND in the camera for the entire time, this is also acceptable and can be corrected later. This could easily happen if you are shooting at a very high ISO or you are unable to get the lights you have available dark enough to expose it properly.
Example of the final shot chart. I had to correct for focus issues and redid +1-10, hence my other note on the slate.
Exposure Calibration
Once you are finished you will need to figure out your mid-tone value, this is basically where the meter places middle gray.
Different camera manufacturers will have placed 18% gray at different IRE levels. Because I have only done Sony and Arri cameras, I only have the notes to those here. You can find the correct value for 18% gray for your camera by googling “18% gray [manufacturer] [camera]” “18% Sony FX6” for example. Be sure to note whether or not the value is for LOG or Rec709. By completing this you will be ensuring that if you were to set your camera at the exposure provided by the meter, 18% gray will be at the correct value on the waveform meter.
Sony Cameras with 709 LUT – 45 IRE
Arri Cameras with 709 LUT – 40 IRE
- Set your camera at T11 at 24fps, 180 degree shutter, at your desired ISO.
- View the gray card on a waveform monitor and adjust your aperture until you get the proper IRE values. Make sure your waveform monitor is showing you as much detail as possible.
- Shoot this chart for 5 seconds.
- Stop down so that you are 5 IRE darker and shoot again.
- Open up so that you are 5 IRE brighter and shoot again.
There is some personal taste involved with the midtone value, so taking these additional shots will allow you to place it where it’s proper, but then also give you an idea of how much movement a few points will give you.
Most likely you are going to do this project in two sittings, so the rest will be covered in a further post. Everything is shot, so you’re doing pretty good!
Quick Shout Out to Ryan E. Walters whose Sekonic articles helped me a ton when figuring all of this out. He has so much information about how to do it and is so detailed, its worth a look!